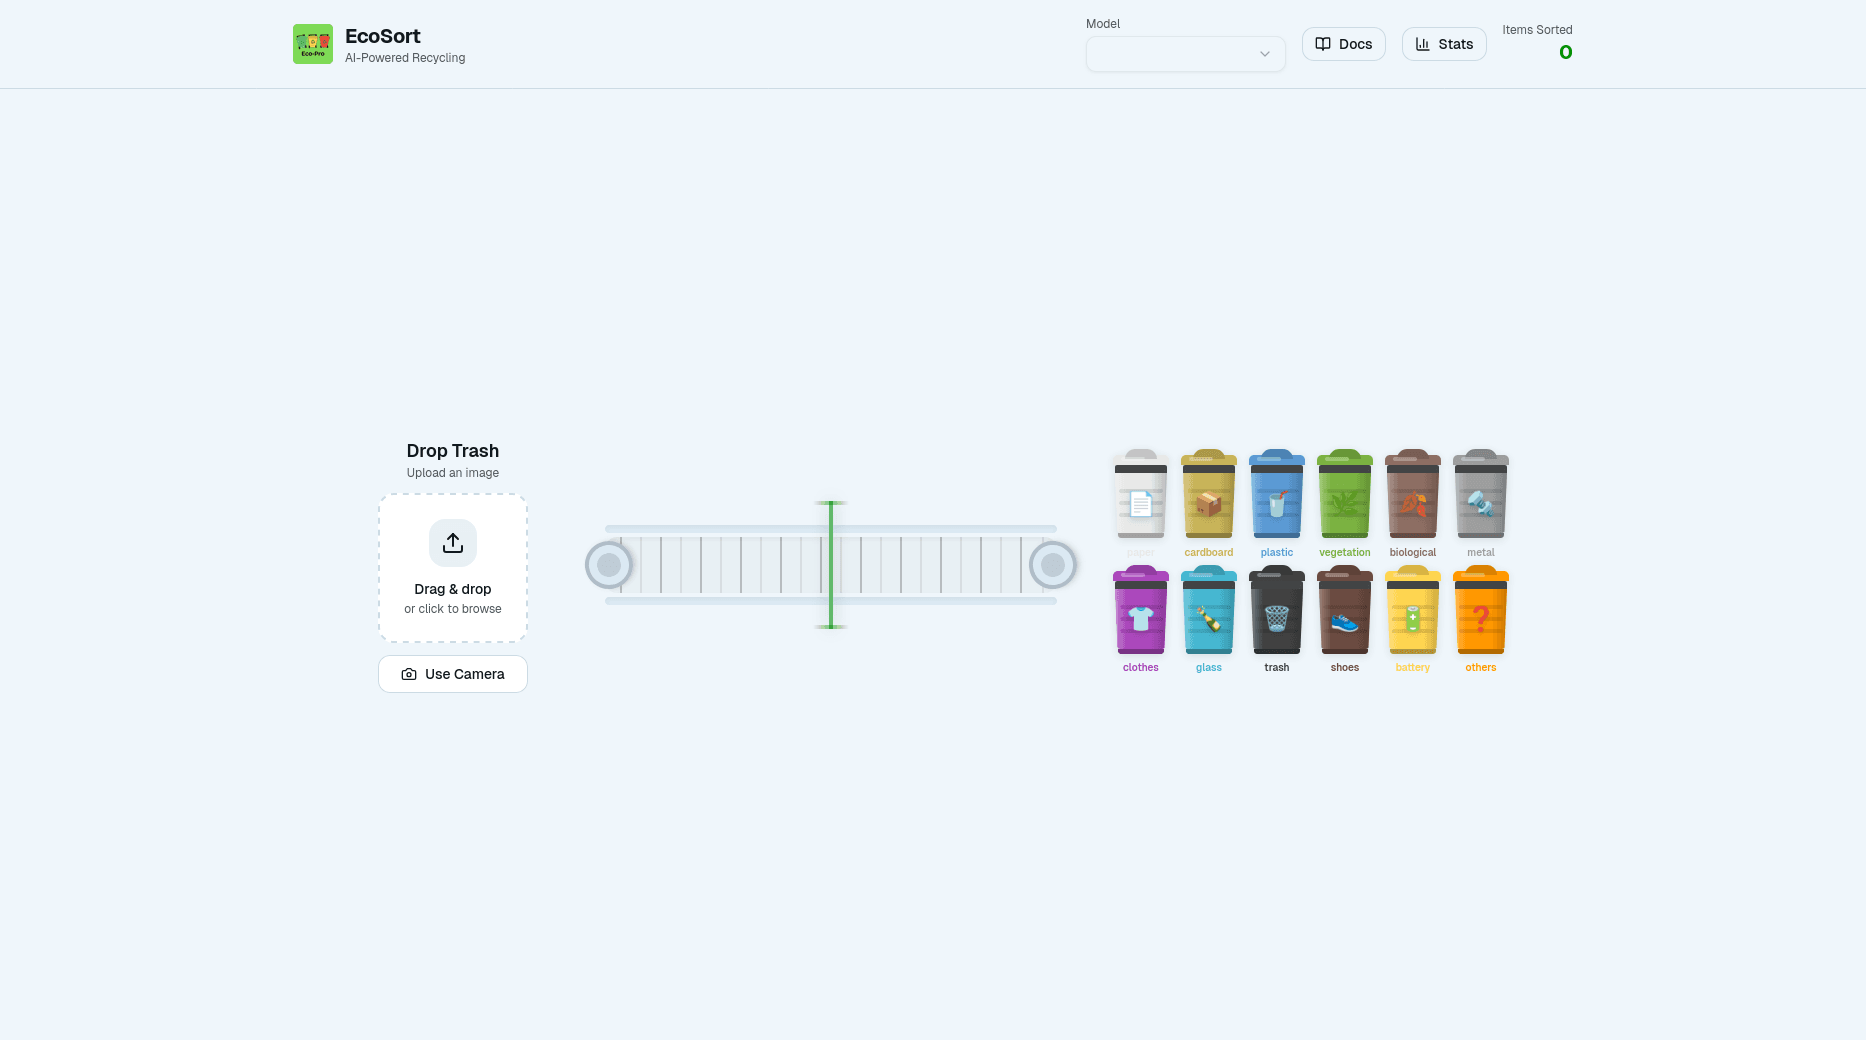
Global waste generation is projected to hit 3.4 billion tonnes a year by 2050 — a 70% jump from 2016 levels. Manual sorting can’t scale to meet that, and it’s slow, inconsistent, and often unsafe for the people doing it. EcoSort is my attempt at a small piece of that problem: an AI system that looks at a photo of a waste item and tells you what bin it belongs in, wrapped in a full-stack web app you can actually use in a browser.
This post walks through how it was built — the dataset, the model, the mistakes, and the numbers that came out the other end.
By the way this was made with the huge help of my project partner Mazen Habib, look him here https://mazenhabib.me/
What EcoSort actually does
Upload a photo (or use your camera), and the item travels down an animated conveyor belt, gets scanned, and drops into the correct bin — Cardboard, Glass, or Plastic (or up to 12 categories, depending on which model is active). It’s not just a demo either — it’s deployed, live, and has a documented history of real classifications.
Live at: ecopro.hamzaihsan.com · docs · stats
Architecture
The system is split into three pieces:
- Frontend — Next.js 16 / React 19 / TypeScript, handling the upload, the conveyor-belt visualization, and the bin-sorting animation.
- Backend — Django REST Framework, serving four interchangeable YOLO models (a 12-class model, two different 3-class models, and a detection-head variant), plus an ensemble endpoint that runs all four and combines their votes.
- Mobile companion — a Flutter app hitting the same classification API, with camera capture and confidence bars.

The dataset
Training data came from three sources, deliberately combined: TrashNet’s clean, studio-lit images for baseline features, and two Roboflow collections for real-world variety — outdoor shots, clutter, damaged items, mixed lighting. After filtering and deduplication, the final curated set for the reported model was 5,569 images across three classes.
| Class | Count | Share |
|---|---|---|
| Cardboard | 1,352 | 24.3% |
| Glass | 2,431 | 43.7% |
| Plastic | 1,786 | 32.0% |


One thing worth calling out: a smaller, carefully curated 5.5K set actually outperformed earlier experiments with a noisier 15K+ scraped dataset. Quality beat quantity here.
What the data revealed before any training happened
A pass of exploratory analysis surfaced three patterns that turned out to predict exactly where the model would later struggle:
Color. Cardboard clusters tightly in low-saturation, high-brightness, yellow-brown hues. Glass splits into two modes — a “transparency signature” (near-zero saturation, high brightness) for clear glass, and a second cluster for colored glass. Plastic spans almost the entire hue spectrum, which turned out to be a warning sign.
Texture. Gabor-filter analysis showed cardboard producing low-frequency, uniform responses (matte, flat), while glass produced high-frequency, direction-dependent responses (specular highlights, reflections). Plastic sat in between, overlapping both.
Shape. A perimeter-to-area complexity metric showed cardboard as simple rectangles (1.18), glass as more complex bottle/jar curves (1.43), and plastic as the most irregular (1.67) — ergonomic bottle designs full of grips and tapers.

🖼️ [Image: Texture/Gabor filter heatmap comparison across the three classes]
The overlap between clear plastic and glass in color and texture space was the single biggest hint that this pairing would be the model’s hardest problem — and it was.
Choosing and training the model
After comparing ResNet50, EfficientNet-B0, and several YOLOv11 variants, YOLOv11m (25.6M parameters, 51.2MB on disk) won on a straightforward trade-off: it beat the Nano variant’s accuracy by 6.2 points at roughly double the compute, while getting 98.5% of the Large variant’s accuracy at 40% of the cost — small enough to run on a CPU in production with no GPU required.
Training ran 45 epochs (early-stopped from a 100-epoch budget) on an A100, using AdamW, cosine annealing, and a mix of geometric and photometric augmentation (flips, rotation, brightness/contrast jitter, cutout).


Training loss dropped from 1.92 to 0.08, validation loss from 1.85 to 0.11 — a generalization gap of just 0.03, which is a good sign the model wasn’t just memorizing the training set.
The results
On a held-out test set of 4,513 images the model had never seen:
| Metric | Value |
|---|---|
| Overall accuracy | 78.2% |
| Macro-avg F1 | 77.3% |
| Cohen’s Kappa | 0.643 |
| Class | Precision | Recall | F1 |
|---|---|---|---|
| Cardboard | 74.6% | 69.4% | 71.9% |
| Glass | 85.7% | 91.4% | 88.5% |
| Plastic | 68.9% | 71.4% | 70.1% |


Glass was the clear winner — exactly the class the EDA had flagged as having the most distinctive color and texture signature. Cardboard and plastic lagged, and the confusion matrix explains why.
The problem the EDA predicted: plastic vs. glass
The single biggest error mode: 25.7% of plastic items got misclassified as glass. This wasn’t a surprise by the time training finished — clear PET plastic and glass share near-identical refractive indices (1.57 vs 1.52), similar light transmission, and near-identical specular highlights. RGB imaging alone genuinely can’t separate them reliably; the report’s own conclusion is that this needs near-infrared or polarization imaging to fully solve.
There was a second, smaller confusion pattern too: glossy or laminated cardboard packaging sometimes got read as glass (19.5% of the time), because coatings create the same kind of specular highlight the model had learned to associate with glass surfaces.
Turning it into a product
The model is one piece — the other half was making it something people could actually use. The frontend applies a strict double confidence gate before it’ll commit to a prediction (top confidence ≥ 80%, and a >80% margin over the second-best guess), falling back to an “others” bin rather than guessing wrong with confidence.

The backend also supports an ensemble mode that runs all four models at once and combines their votes — useful for comparing model behavior even though the shipped default uses a single model per request.

What I’d do differently
- Add a second imaging modality. The plastic/glass confusion is a hard ceiling on RGB-only classification — NIR or polarization imaging is the real fix, not more RGB training data.
- Split “plastic” into sub-types. PET, HDPE, and PP look wildly different from each other; lumping them into one class hides real signal the model could otherwise use.
- Calibrate the confidence scores. Right now an 80% confidence score isn’t a calibrated probability — temperature scaling would make the confidence gate more meaningful.